


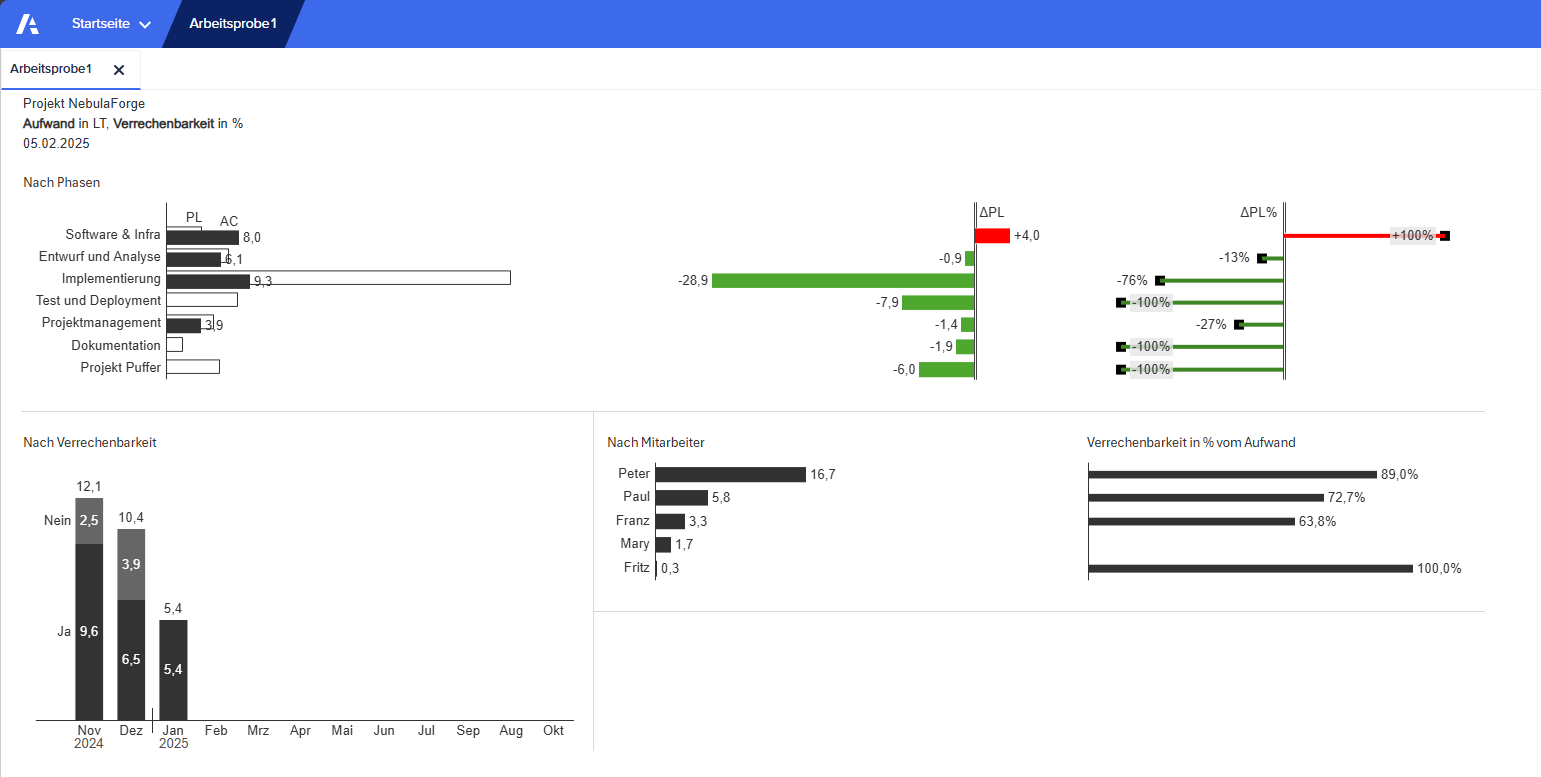
This work sample showcases a dashboard for project managers in BI projects, which consolidates planned and actual efforts from various data sources. The goal was to make deviations visible at an early stage and reliably evaluate the billability of the efforts.
The dashboard visualizes the effort by project phases, employees, and time progression. This allows project managers to quickly identify where plans and reality diverge, and which services are not billable.