


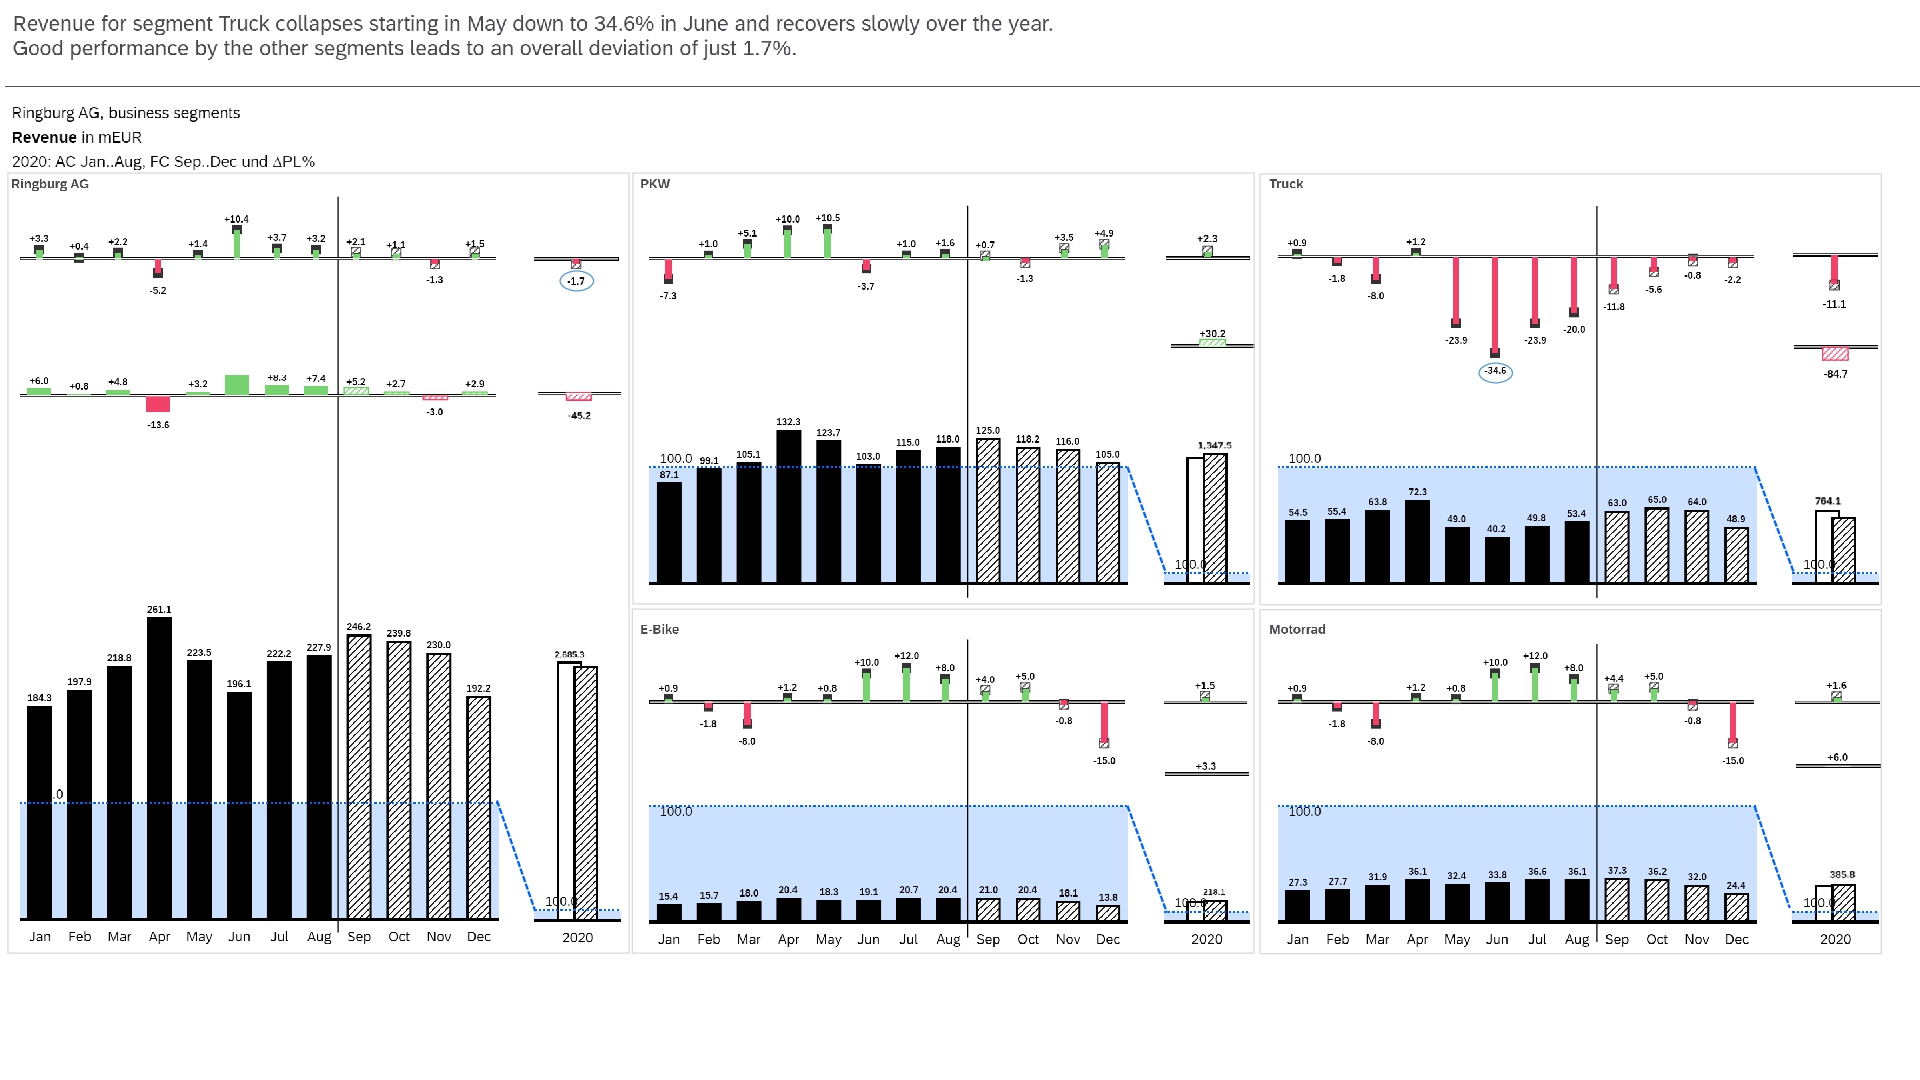
The report shows the plan deviation during the year by business segments as well as the whole company. Actual data is compared to plan data. FC data is used instead of actuals for open periods. With the use of scaling areas, even total year values can be displayed. This enables quick insight in the current and the predicted situation of the segments as well as the total company.