


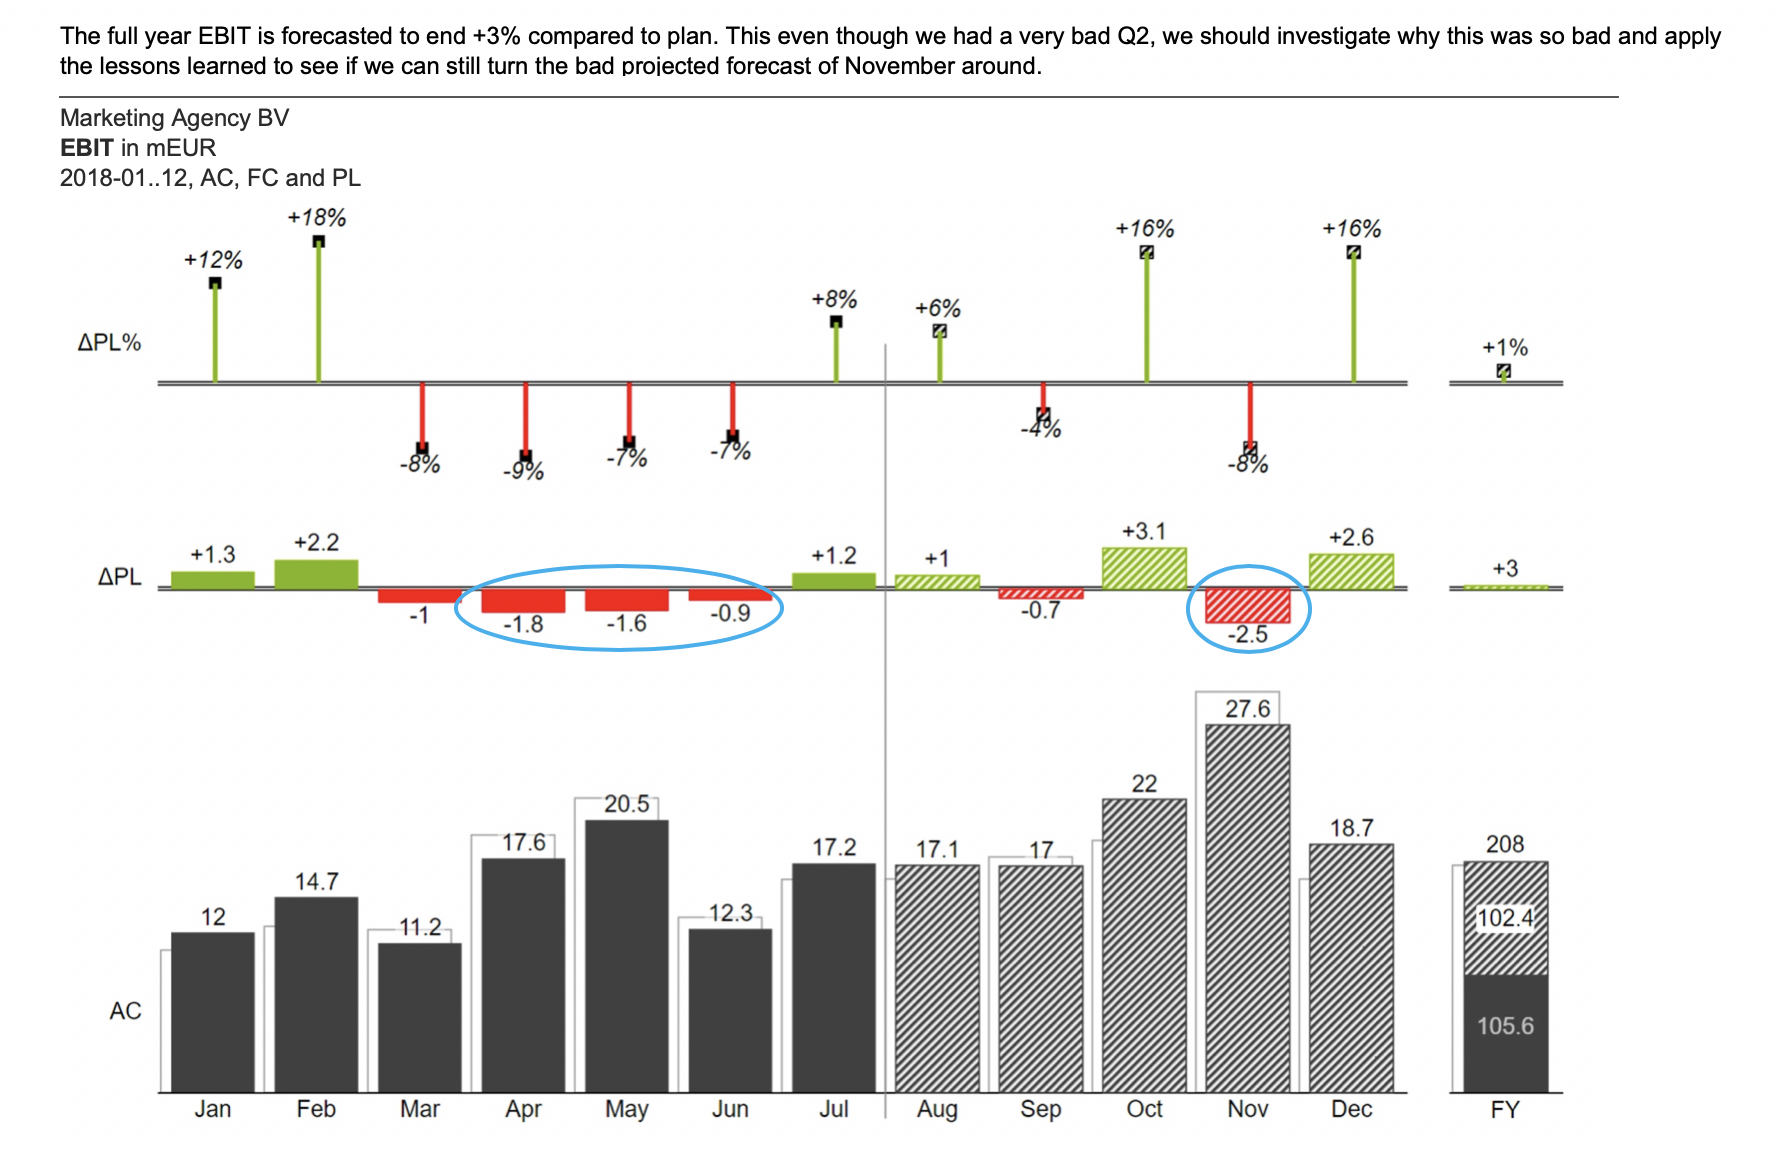
This graph has been created in Power BI using the standard functionalities of the Zebra BI plug in. The graph shows the EBIT development for the year and includes a forecast to see where they will end up at the end of the year.
This graph has been created in Power BI using the standard functionalities of the Zebra BI plug in. The graph shows the EBIT development for the year and includes a forecast to see where they will end up at the end of the year.
You need to load content from reCAPTCHA to submit the form. Please note that doing so will share data with third-party providers.
More InformationYou need to load content from Turnstile to submit the form. Please note that doing so will share data with third-party providers.
More Information