


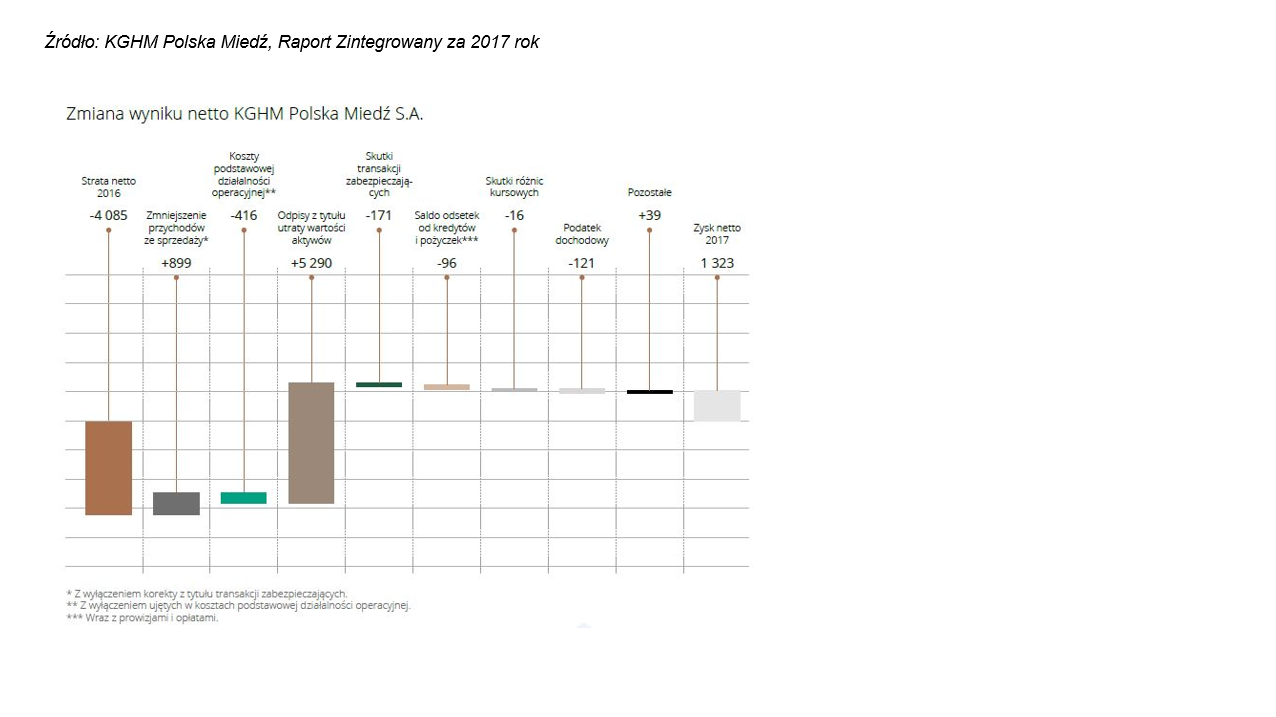
The waterfall chart shows the impact of the components on the change in the net result between two years.
The waterfall chart shows the impact of the components on the change in the net result between two years.
You need to load content from reCAPTCHA to submit the form. Please note that doing so will share data with third-party providers.
More InformationYou need to load content from Turnstile to submit the form. Please note that doing so will share data with third-party providers.
More Information