


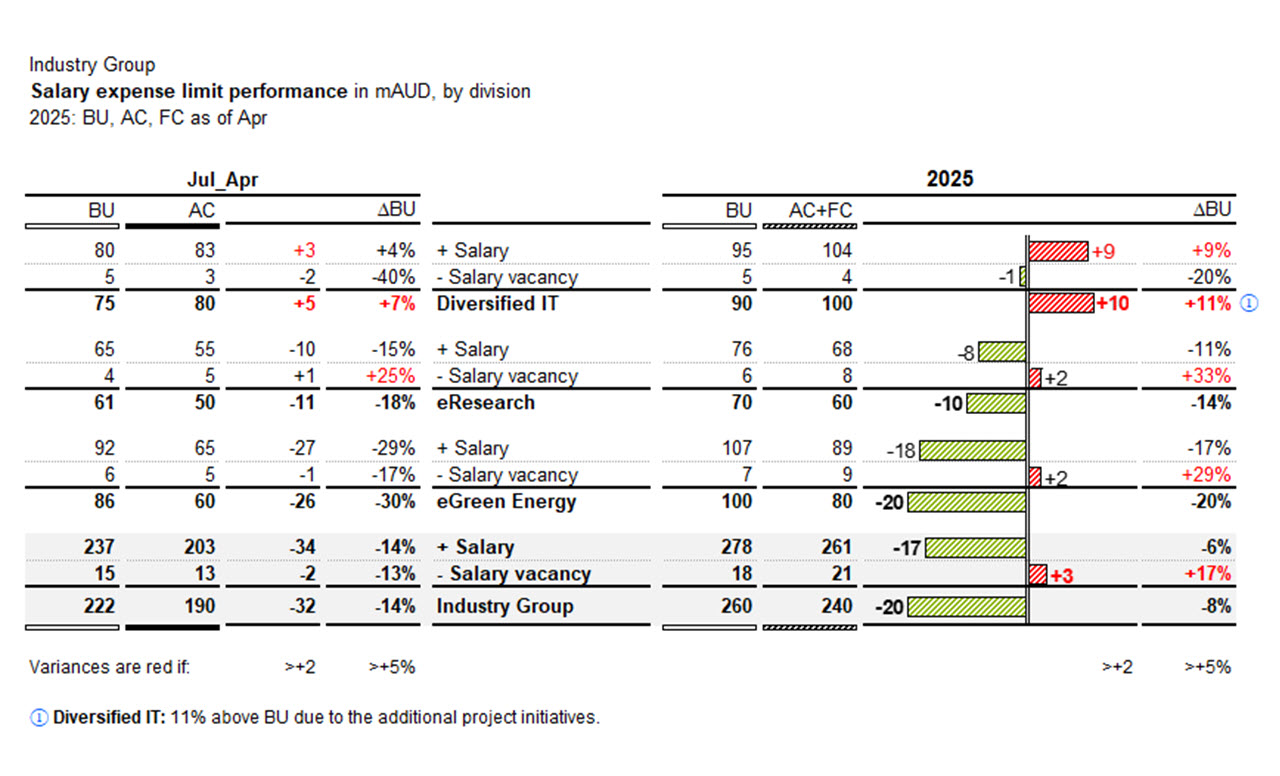
The optimised table presents a division-centric view, comparing the Jul-Apr and 2025 periods with budget, and actual plus forecast (AC+FC), absolute and relative variances, and includes colour highlights as per performance rationale. The table uses nested rows to iteratively calculate the ‘Salary expense limit’ by division.