


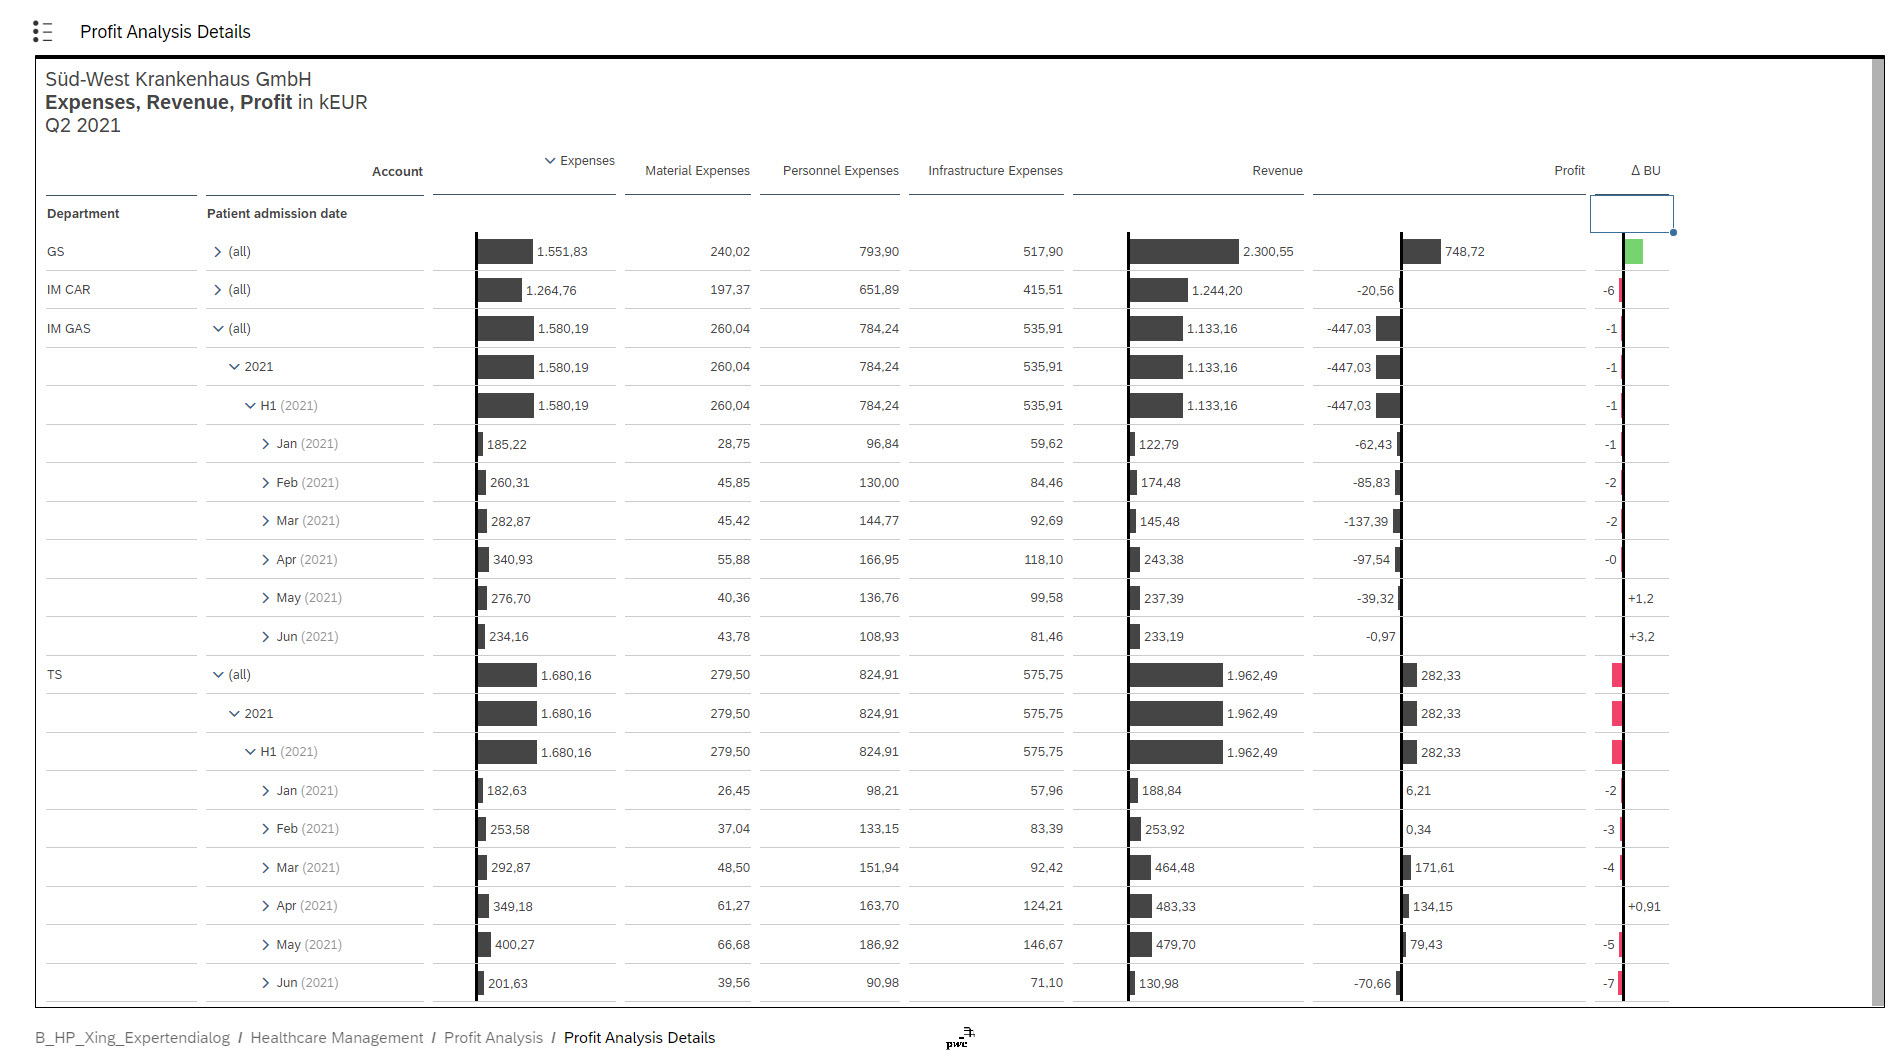
For deeper analyzing the financial KPIs you can jump from the page before to the given table. Through In-Cell-Charts it is possible to visually understand the ratios between the figures.
For deeper analyzing the financial KPIs you can jump from the page before to the given table. Through In-Cell-Charts it is possible to visually understand the ratios between the figures.
You need to load content from reCAPTCHA to submit the form. Please note that doing so will share data with third-party providers.
More InformationYou need to load content from Turnstile to submit the form. Please note that doing so will share data with third-party providers.
More Information