


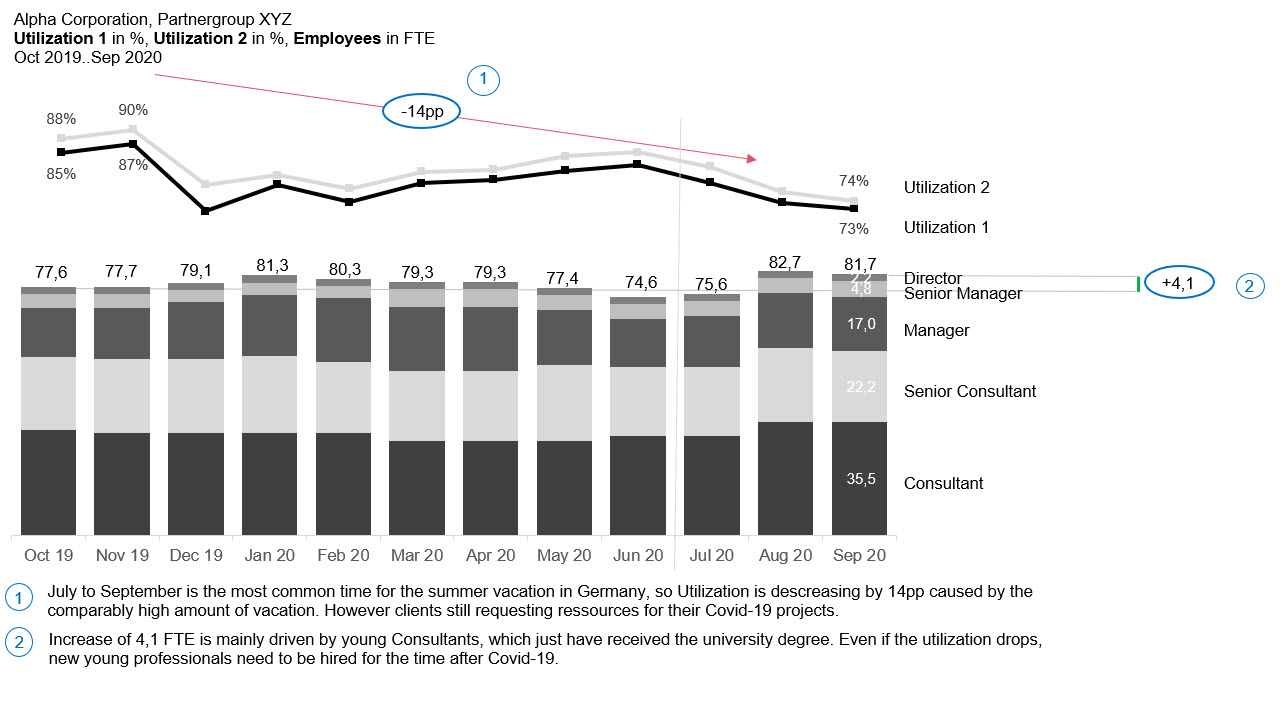
In the third chart FTE are displayed in their individual hierarchical levels as a stacked chart. The two utilization figures (Utilization 1 and Utilization 2) can be directly recorded by the reader and put into context. Important explanations are attached as comments.