


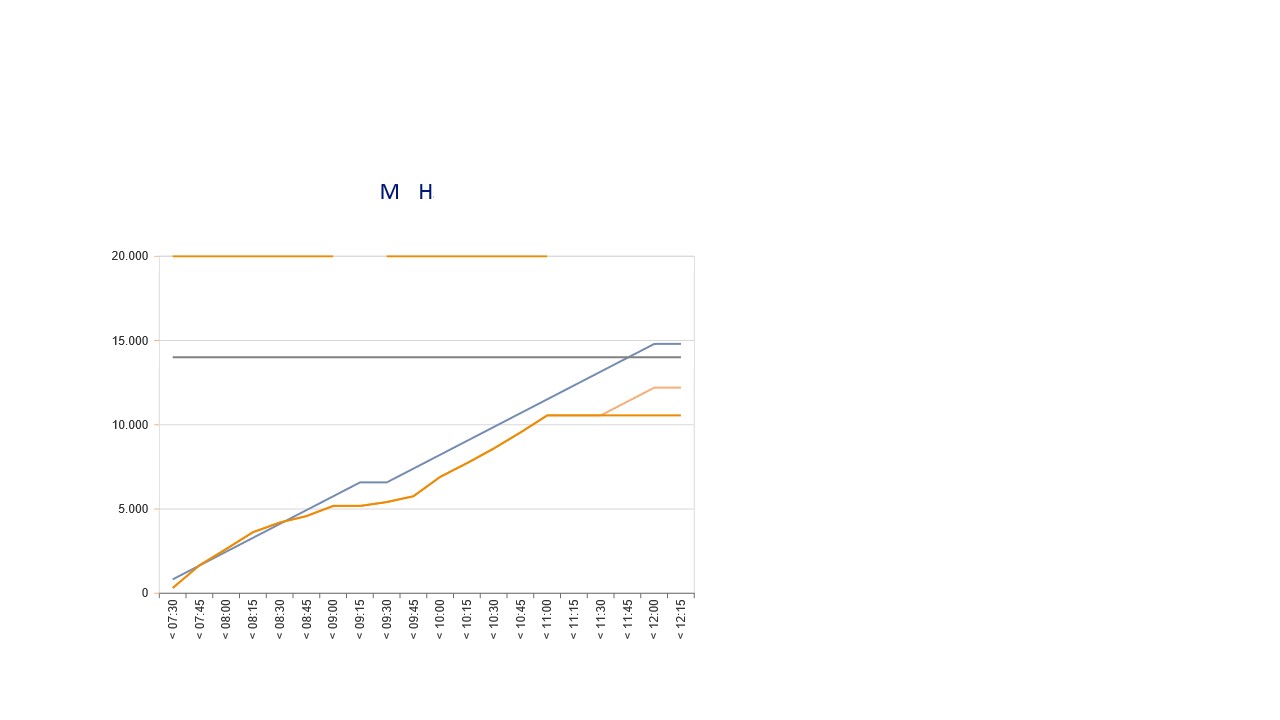
This chart is used to monitor the progress of the production of one machine in one plant. In total there are 5 plants with six machines. These charts are near real-time and spread out over 5 screens, one for each plant.
This chart is used to monitor the progress of the production of one machine in one plant. In total there are 5 plants with six machines. These charts are near real-time and spread out over 5 screens, one for each plant.