


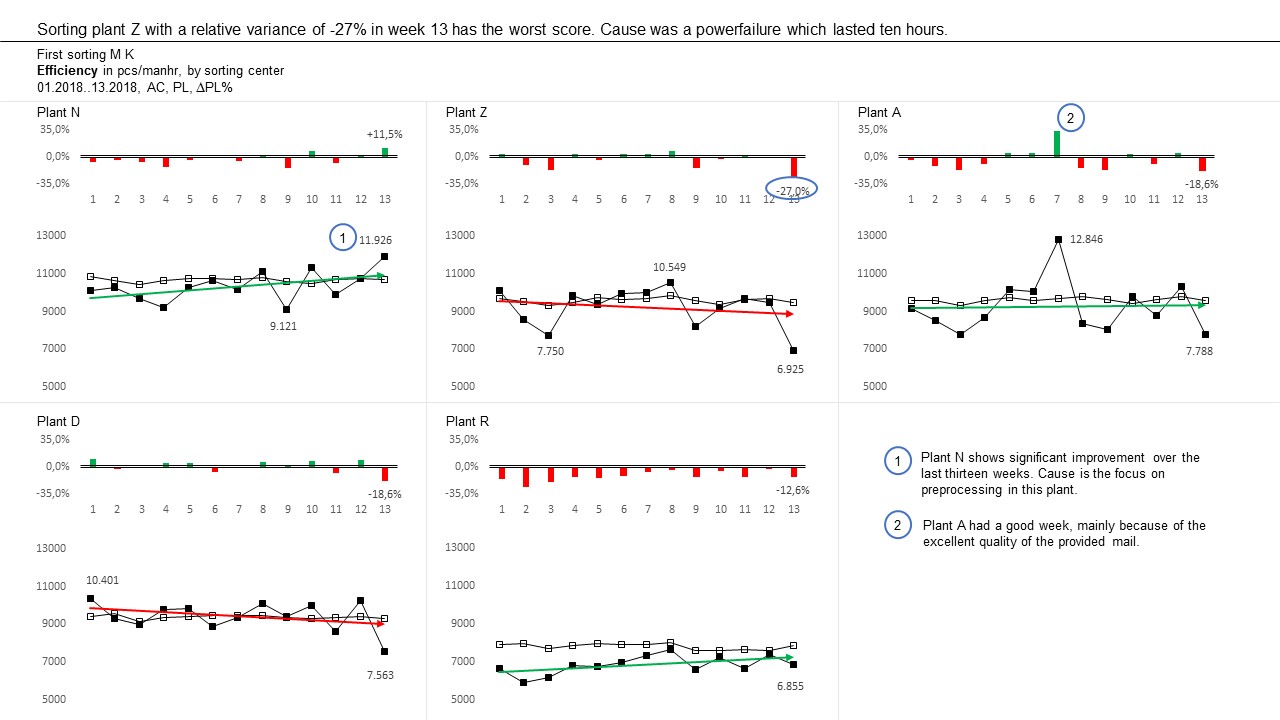
Original chart made IBCS-compliant. Axis of the base chart are not set to zero, due to the fact that the lines show small variance of big numbers. Therefore the axis is placed above the base chart, to avoid a visual misleading interpretation. Extra is the relative variance between actual and planning. Message and title, as well as a highlight and two comments are added for a quicker and better understanding of the results.