


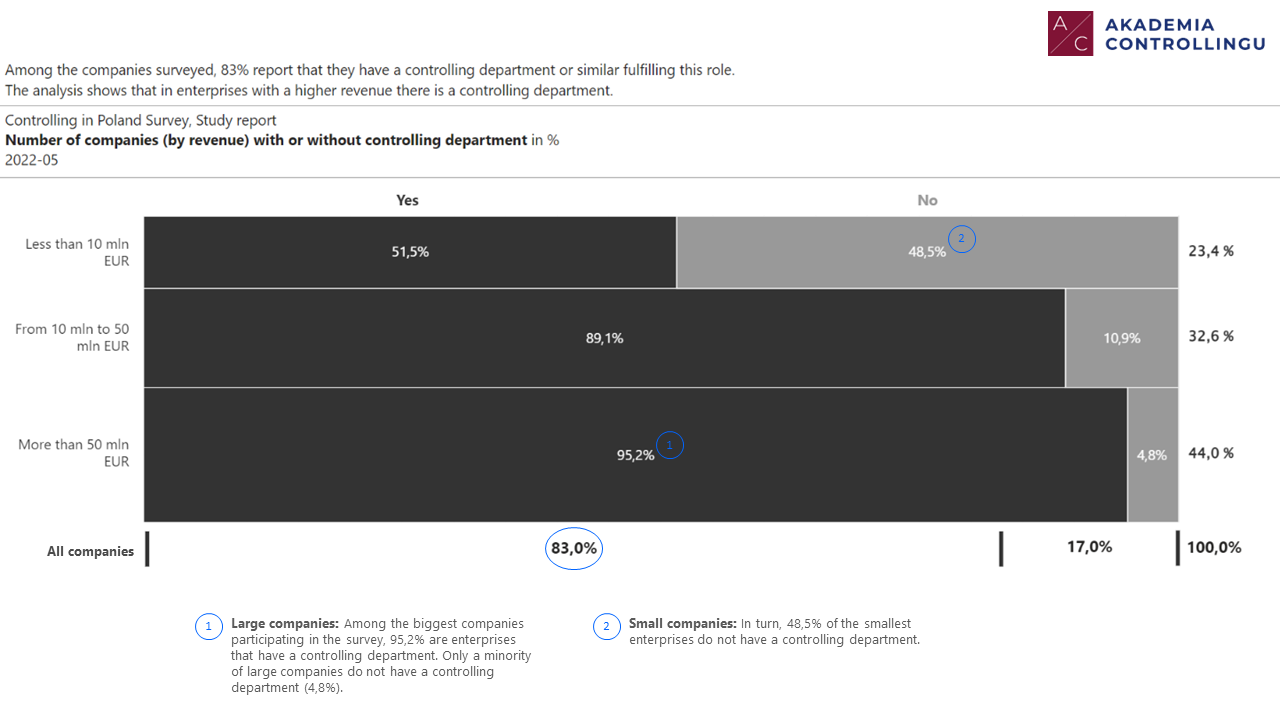
This report shows the number of enterprises with and without a controlling department (first category – horizontal axis) in the entire population of surveyed companies, divided by the size of revenue (second category – vertical axis). The report uses the Marimekko Chart which is used to visualize categorical data from a pair of variables. In the chart both axes are variables with a percentage scale, that determines both the width and height of each category.