


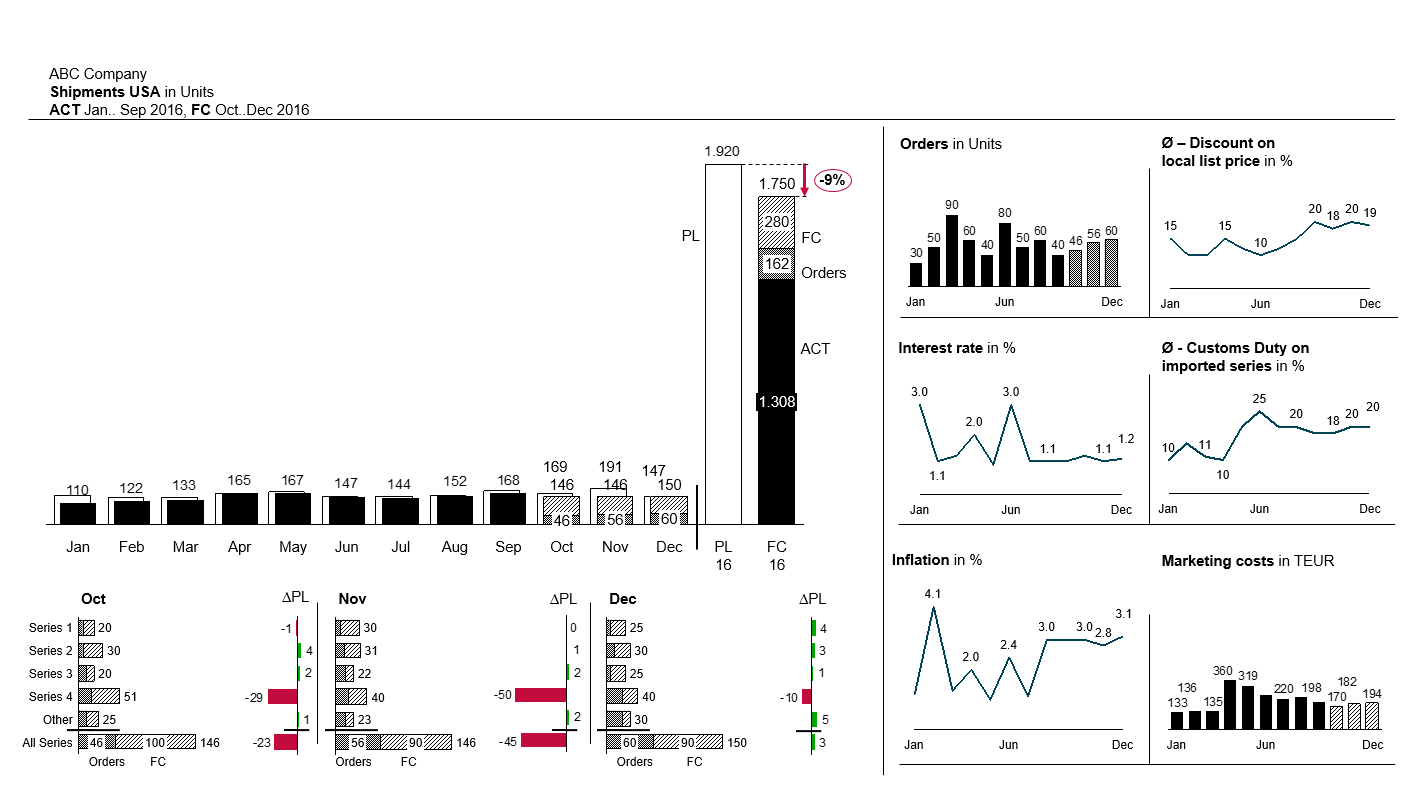
Visualization of shipments USA of the ABC company. The Dashboard shows an overview of the total year with a detailed analysis of the forecast. Moreover it provides information about the main correlation factors (on the right). The analysis of the Dashboard clearly reveals a gap between forecast and plan in October and November caused by low performance of series 4.
From this we can derive a message which is vizualized in the report on slide 3.