


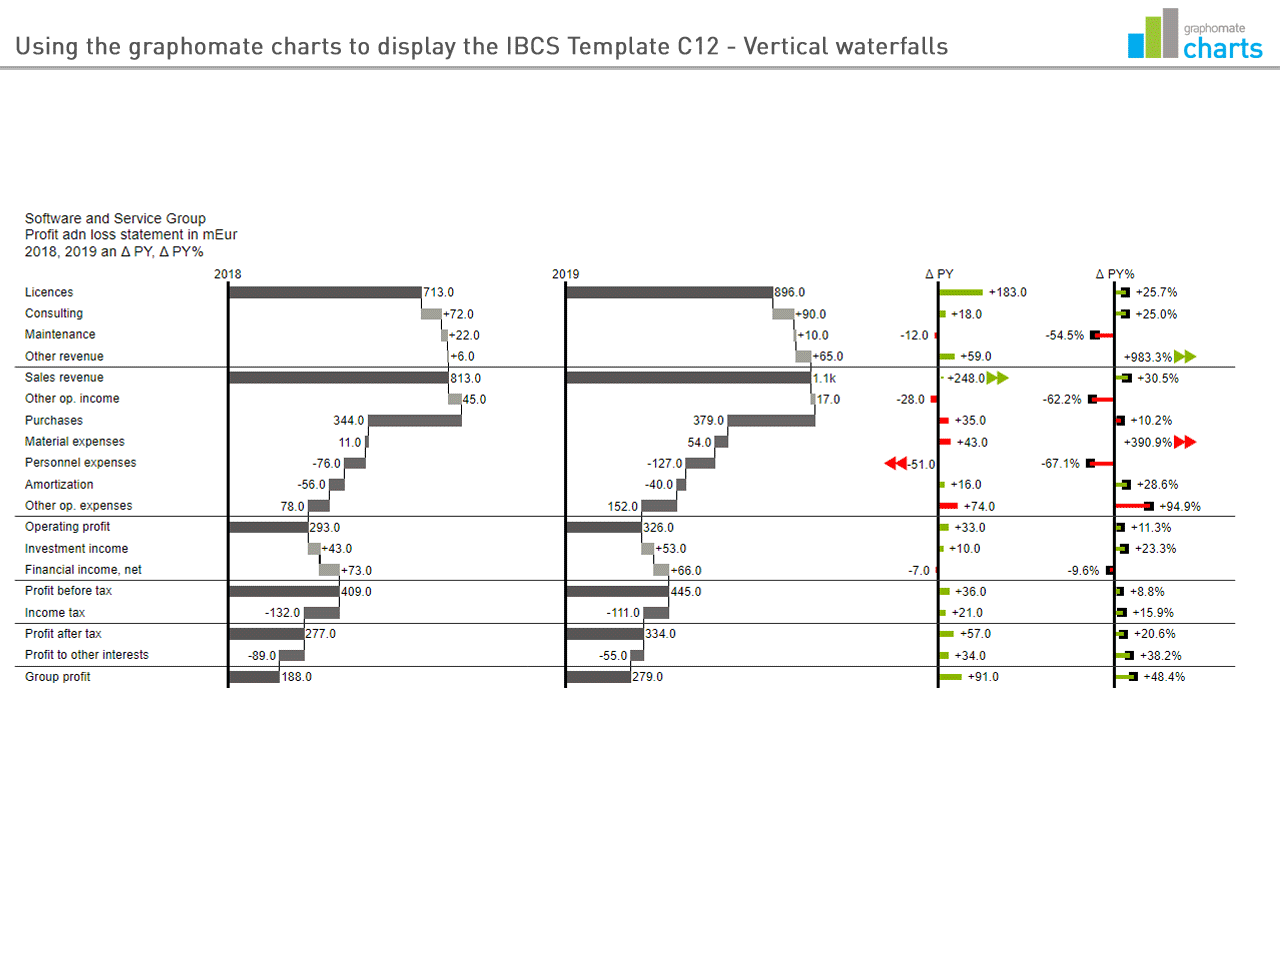
With the graphomate charts, the profit and loss statement can be depicted graphically. Likewise, the presentation of the deviation increases the density of information.
With the graphomate charts, the profit and loss statement can be depicted graphically. Likewise, the presentation of the deviation increases the density of information.
You need to load content from reCAPTCHA to submit the form. Please note that doing so will share data with third-party providers.
More InformationYou need to load content from Turnstile to submit the form. Please note that doing so will share data with third-party providers.
More Information