


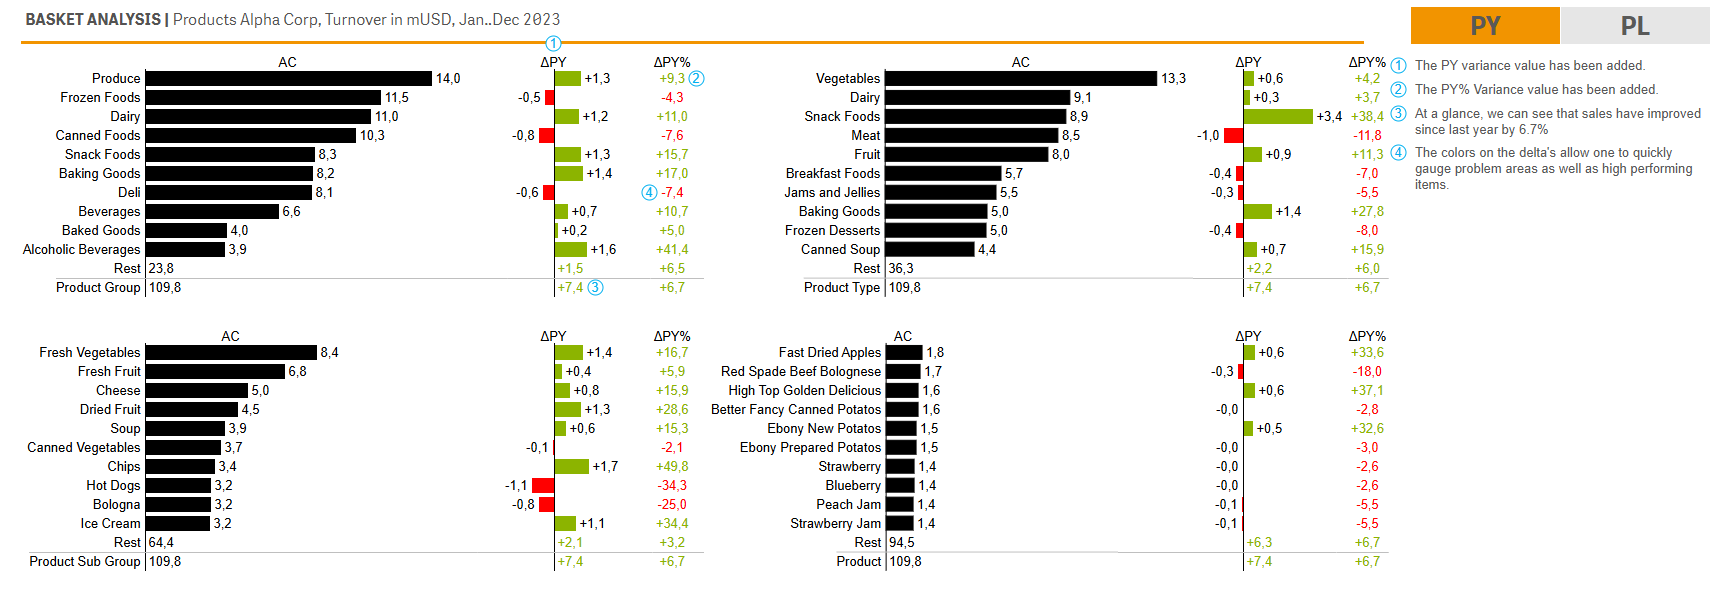
This TRUECHART Basket Analysis shows sales in relation to the Product hierarchy and highlights change versus the previous period. Using IBCS principles such as uniform scales, consistent notation, and green/red variance bars makes comparisons quick and reliable across all charts. Users can select any category to drill down, while on-chart comments add business context to wins and issues.